Assignments and Quizzes are the traditional tools used to gauge how a student is actually learning and what kind of progress they’ve made in your course. However, the score received by students in a test or assignment is not the only measure of how well learners have understood the material.
Learning analytics can help you track the behaviour of learners and help you to adjust the design, content and functionality of what students do in the course. The data generated in an online classroom can be leveraged and visualized to identify how well learning assessments are aligned with the learning objectives.
There are a number of tools in Moodle that can be used to view trends of participation and submission, which can assist instructors to improve the learning experience. These tools can help:
- Identify if and when a student has logged into your course
- Determine when students are accessing their Moodle course and which activities and resources they have viewed or completed
- View student participation in activities, such as discussion forums and send messages to students who have not completed certain items.
- Set learning paths for students using completion activities
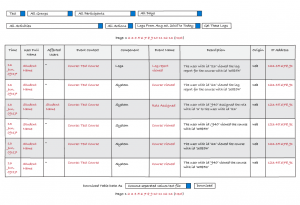
Logs
The Logs report shows information about a particular student or activity. It allows you to see which resources or activities have been accessed and when. You can access logs to see if an individual student has viewed a specific resource or participated in a particular activity. It is particularly useful to trace your student footprints from the time they have accessed the course to what they have accessed.
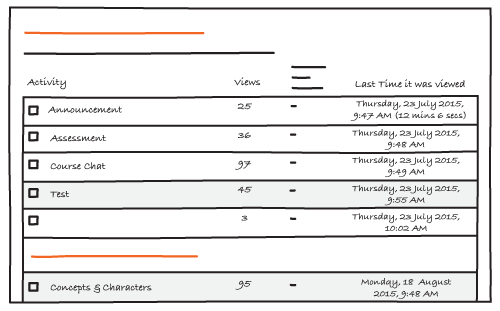
Activity Report
The Activity Report shows the number of times an activity or resource has been viewed in your course and the date the item was last viewed. It is a simple report and is a quick way to see the most viewed content on your site. It allows you to examine when students are viewing certain activities or resources more than others and how often. This report will give you a sense of the number of students actively participating in your course and will help you understand if students are frequently accessing material earlier in the term and then tapering off towards the end so that you can adapt strategies to encourage access to activities and resources in your course.
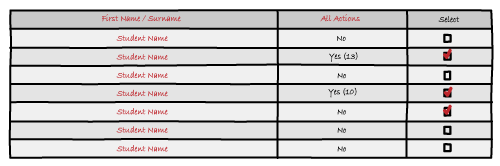
Course Participation Report
The Course Participation Report provides an easy way to monitor participation of students in your course. Although it can be used to monitor activities and resources, it is particularly useful for monitoring activity in Forums. You can see if students have viewed a forum post and the number of times they have done so. In addition, it also shows the number of times they have posted in the forum or an activity. A special feature of the Course Participation Report is the ability to send a message to those students that have not completed an activity.
Activity Completion Report
Completion tracking allows resources and activities to be marked completed manually or when certain conditions have been met. By configuring criteria at an activity or resource level, you can then have a one stop view of students progress for each of these items through the Activity Completion report

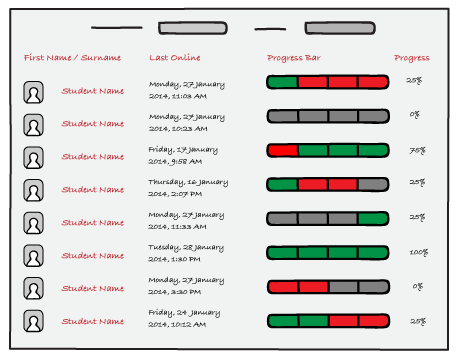
Progress Bar
The Progress Bar is a visual time management tool for students and instructor to keep track of the completion of the course activities and resources. You select which course items are monitored in a bar graph that indicates which items are complete, incomplete or late. The Progress bar appears to both students and instructors as a block on the main course page. Students will see a colour-coded bar on their block representing the completion status of the specific course activities as selected by you.

Get in touch with Sairam today to chat about different ways we might be able to assist you with your course goals.